Alternative Insight
Economic Predictions
Graphs Predicted a US Economic Crisis
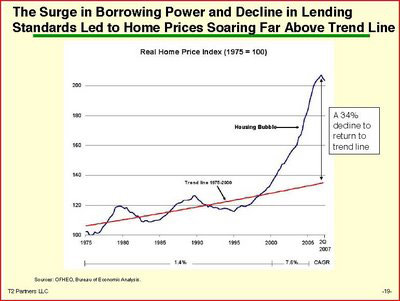
A few graphed statistics, which charted the direction of the U.S. economy during the last years, predicted an eventual economic crisis.The average increase of housing prices adjusted for inflation rose slowly until about 1999. Its abnormal dramatic rise indicates an equally dramatic readjustment still has a way to go.
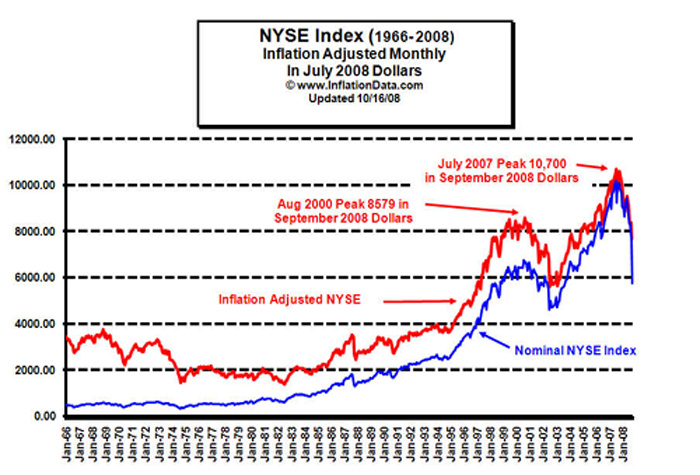
The average increase of stock prices adjusted for inflation rose slowly until about 1995. Its abnormal dramatic rise indicates an equally dramatic readjustment still has a way to go.
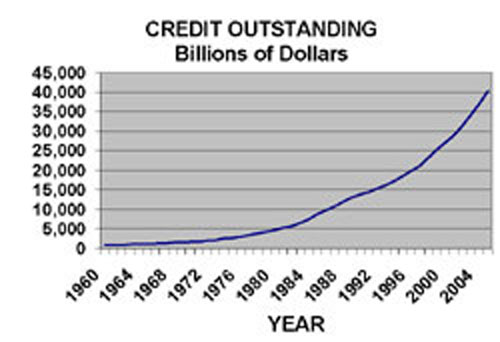
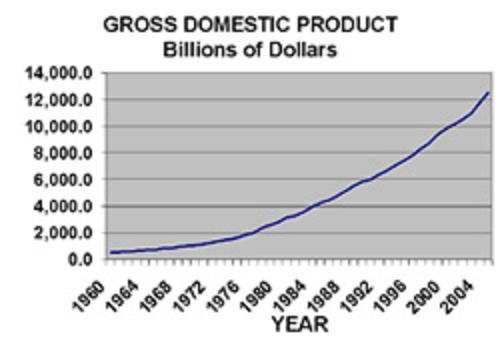
The abrupt rise in credit, due to lax credit restrictions, fueled the housing bubble and the rapid increases in Gross National Product. Both followed similar trends. The steep slope of the curves indicates the trends are not sustainable.
Data from U.S. Department of Commerce, Bureau of Economic Analysis.
The future of the U.S. might follow past occurrences where disinflation leading to deflation were eventually overcome by wartime inflation. The U.S. Rate of Inflation increased greatly during wartime periods of WWI, WWII, Korean War and Vietnam War. It has not increased during the engagements in Iraq and Afghanistan (not shown).
The militaristic and totalitarian nations of Germany, Italy and Japan emerged more quickly from the Great Depression.
The statistics told the story and are still telling it.
Will the US follow a pattern that requires oppression and militarism in order to emerge from an economic depression? Hopefully Obama's team will read the charts with ability and conviction.
alternativeinsight
December 1, 2008HOME PAGE MAIN PAGE 
alternativeinsight@earthlink.net